Make Pretty Charts For Your App with jQuery and xCharts
Charts are a great visual aid when presenting data. You can't build a professional admin panel without them. They are also tricky to set up. However, there is a new library that makes things easier - xCharts. Today, we are going to use it along with the daterange picker for Twitter Bootstrap, to build a pretty, AJAX-powered chart for your web application that fetches data from a MySQL table.
The HTML
The HTML structure of the demo is pretty simple - we have to add elements on the page for the initialization of the chart, and for the date picker. As we are including bootstrap in the page anyway, we can make use of its form styling abilities and icons to make it look good.
index.php
<!DOCTYPE html>
<html>
    <head>
        <meta charset="utf-8" />

        <title>Pretty Charts with jQuery and AJAX | Tutorialzine Demo</title>
        <link href="assets/css/xcharts.min.css" rel="stylesheet">
        <link href="assets/css/style.css" rel="stylesheet">

        <!-- Include bootstrap css -->
        <link href="assets/css/daterangepicker.css" rel="stylesheet">
        <link href="//cdnjs.cloudflare.com/ajax/libs/twitter-bootstrap/2.2.2/css/bootstrap.min.css" rel="stylesheet" />

    </head>
    <body>
        <div id="content">

            <form class="form-horizontal">
              <fieldset>
                <div class="input-prepend">
                  <span class="add-on"><i class="icon-calendar"></i></span>
                  <input type="text" name="range" id="range" />
                </div>
              </fieldset>
            </form>

            <div id="placeholder">
                <figure id="chart"></figure>
            </div>

        </div>

        <script src="https://ajax.googleapis.com/ajax/libs/jquery/1.8.3/jquery.min.js"></script>

        <!-- xcharts includes -->
        <script src="//cdnjs.cloudflare.com/ajax/libs/d3/2.10.0/d3.v2.js"></script>
        <script src="assets/js/xcharts.min.js"></script>

        <!-- The daterange picker bootstrap plugin -->
        <script src="assets/js/sugar.min.js"></script>
        <script src="assets/js/daterangepicker.js"></script>

        <!-- Our main script file -->
        <script src="assets/js/script.js"></script>

    </body>
</html>
We are including a good deal of external resources here. In the head section, we have the css files for xcharts, the datepicker, bootstrap (included from cloudflare's super fast cdn), and our style.css file.
Before the closing body tag, we have the jQuery library, d3.js (required by xcharts), xcharts, the elegant sugar.js library (required by the date range plugin), the date range plugin and our script.js. In the next steps you will see how all of these work together.
The MySQL Table
As I mentioned in the intro, the script we are writing will fetch its data from a MySQL table and display it on the chart. You can find the SQL code that will create the table in schema.sql in the zip file, available for download from the buttons above. This is what the table looks like:
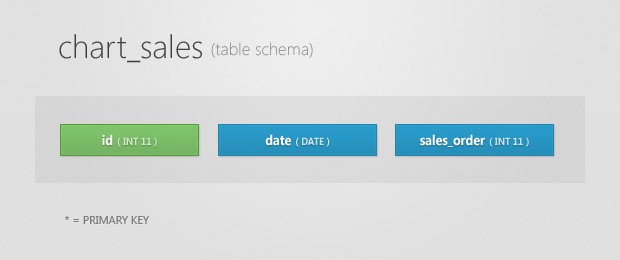
It has only three fields. The date field is assigned a unique index, which means that there cannot be duplicate records for the same day. The sales_ord field holds the number of sales for the day. Your database will surely differ, but as long as you return the correct JSON response from your PHP script, there won't be any problems (more on that in the next section).
Note: Remember to enter your MySQL connection details in setup.php. You will then have to create a new MySQL database, and import schema.sql from phpMyAdmin or your management system of choice.
The PHP Code
In our PHP script, we will select the records from the table that correspond to the passed start and end date, assemble an array, and output it as a JSON:
ajax.php
header('Content-Type: application/json');

// Set up the ORM library
require_once('setup.php');

if (isset($_GET['start']) AND isset($_GET['end'])) {

    $start = $_GET['start'];
    $end = $_GET['end'];
    $data = array();

    // Select the results with Idiorm
    $results = ORM::for_table('chart_sales')
            ->where_gte('date', $start)
            ->where_lte('date', $end)
            ->order_by_desc('date')
            ->find_array();

    // Build a new array with the data
    foreach ($results as $key => $value) {
        $data[$key]['label'] = $value['date'];
        $data[$key]['value'] = $value['sales_order'];
    }

    echo json_encode($data);
}
Here I am using a favorite library of mine - Idiorm. I have used it before in tutorials in the site (and in many personal projects). It is only one file (located in the lib/ folder) and makes working with databases a pure joy. All I am doing is selecting all the results from the database, which have a date value between the start and end timestamps passed with the request.
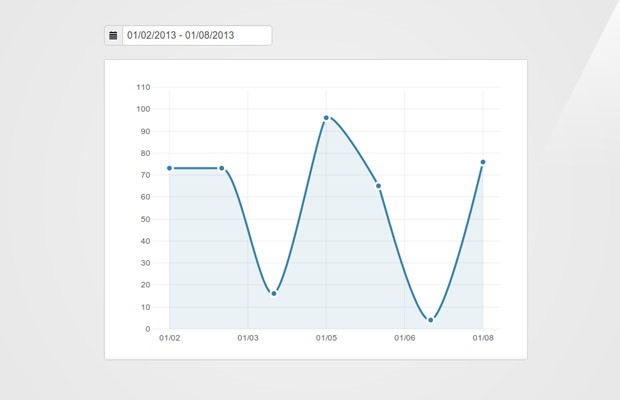
The resulting JSON response looks similar to this:
[{
    "label": "2013-01-07",
    "value": "4"
}, {
    "label": "2013-01-06",
    "value": "65"
}, {
    "label": "2013-01-05",
    "value": "96"
}]
The label properties contain the MySQL date values for the respective row, and the values - the number of sales for that day. It is up to our JavaScript code to correctly handle this data and turn it into a format suitable for use with the xCharts plugin.
The JavaScript
All of our JS code lies in assets/js/script.js. The code is a bit long, and to make it easier to follow I will present it to you in chunks.
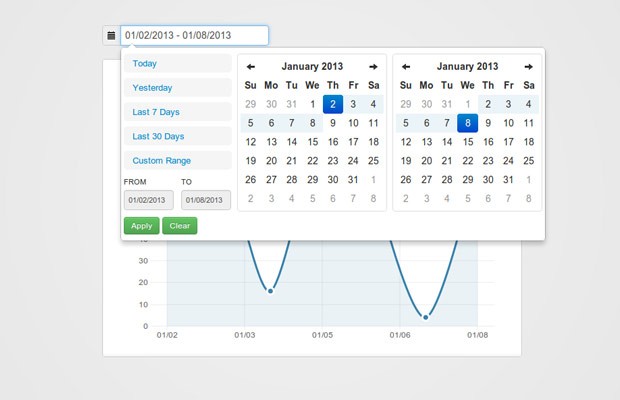
First we will declare a few variables and initialize the date range picker plugin. Notice that the date range I linked to is a fork of the original plugin. I decided to go with this version, as the original depends on date.js - a very old date/time library that conflicts with xCharts. The fork instead uses sugar.js which is a nice utility library with powerful date and time support.
assets/js/script.js
$(function() {

    // Set the default dates, uses sugarjs' methods
    var startDate   = Date.create().addDays(-6),    // 6 days ago
        endDate     = Date.create();                // today

    var range = $('#range');

    // Show the dates in the range input
    range.val(startDate.format('{MM}/{dd}/{yyyy}') + ' -
        ' + endDate.format('{MM}/{dd}/{yyyy}'));

    // Load chart
    ajaxLoadChart(startDate,endDate);

    range.daterangepicker({

        startDate: startDate,
        endDate: endDate,

        ranges: {
            'Today': ['today', 'today'],
            'Yesterday': ['yesterday', 'yesterday'],
            'Last 7 Days': [Date.create().addDays(-6), 'today'],
            'Last 30 Days': [Date.create().addDays(-29), 'today']
            // You can add more entries here
        }
    },function(start, end){

        ajaxLoadChart(start, end);

    });
As you can see, we are making good use of sugar.js' date and time methods to define the start and end point of the range. I am initializing the script with the results from the last 7 days, and updating the range input field.
Now let's create the chart:
    // The tooltip shown over the chart
    var tt = $('<div class="ex-tooltip">').appendTo('body'),
        topOffset = -32;

    var data = {
        "xScale" : "time",
        "yScale" : "linear",
        "main" : [{
            className : ".stats",
            "data" : []
        }]
    };

    var opts = {
        paddingLeft : 50,
        paddingTop : 20,
        paddingRight : 10,
        axisPaddingLeft : 25,
        tickHintX: 9, // How many ticks to show horizontally

        dataFormatX : function(x) {

            // This turns converts the timestamps coming from
            // ajax.php into a proper JavaScript Date object

            return Date.create(x);
        },

        tickFormatX : function(x) {

            // Provide formatting for the x-axis tick labels.
            // This uses sugar's format method of the date object.

            return x.format('{MM}/{dd}');
        },

        "mouseover": function (d, i) {
            var pos = $(this).offset();

            tt.text(d.x.format('{Month} {ord}') + ': ' + d.y).css({

                top: topOffset + pos.top,
                left: pos.left

            }).show();
        },

        "mouseout": function (x) {
            tt.hide();
        }
    };

    // Create a new xChart instance, passing the type
    // of chart a data set and the options object

    var chart = new xChart('line-dotted', data, '#chart' , opts);
First I define a configuration object for xCharts, with properties and callback functions. In the dataFormatX property, I am transforming the yyyy-mm-dd strings returned from the AJAX request, into proper JavaScript Date objects, so that the plugin can correctly display them and do its calculations.
I am also passing an event handler for the mouseover/mouseout plugin events, and use them to show a tooltip (the plugin doesn't come with one out of the box).
Lastly, here is the JavaScript function for loading data with AJAX:
   // Function for loading data via AJAX and showing it on the chart
    function ajaxLoadChart(startDate,endDate) {

        // If no data is passed (the chart was cleared)

        if(!startDate || !endDate){
            chart.setData({
                "xScale" : "time",
                "yScale" : "linear",
                "main" : [{
                    className : ".stats",
                    data : []
                }]
            });

            return;
        }

        // Otherwise, issue an AJAX request

        $.getJSON('ajax.php', {

            start:  startDate.format('{yyyy}-{MM}-{dd}'),
            end:    endDate.format('{yyyy}-{MM}-{dd}')

        }, function(data) {

            var set = [];
            $.each(data, function() {
                set.push({
                    x : this.label,
                    y : parseInt(this.value, 10)
                });
            });

            chart.setData({
                "xScale" : "time",
                "yScale" : "linear",
                "main" : [{
                    className : ".stats",
                    data : set
                }]
            });

        });
    }
});
xCharts exposes the setData method so you can easily replace the displayed data. The className attribute is important, as this is what the plugin uses to identify your chart. If you omit this property, all kinds of strange bugs will occur (trust me, I know).
With this our pretty charts are complete!
We're done!
You can use this example to enhance your admin areas and to visualize statistical data in a beautiful interface.
Bootstrap Studio
The revolutionary web design tool for creating responsive websites and apps.
Learn more
Excelent, very nice tutorial
Wow, i like it :D
Finally Martin! :) I requested this few year's ago :D
THANKS !!
great, I hope more chart will come in this plugins, and can be used for mobile chart
Sometimes more than the application itself, I love how you have introduced me to a lot of useful server/client side libraries (heck, I even migrated my blog to Linode thanks to a recommendations from this site, and I couldn't be happier). In this case I didn't know Idiorm, which seems perfect for applications that need a DB but not a full stack framework. Sure I could assemble several composer libraries to build it but that might be "a little" too much.
Thank you, Martin.
greate!!! but i have problem witch change connection style.
i connect witch:
$db_host= 'xxxl';
$db_user= 'xxx';
$db_pass= 'xxx';
$db_database= 'xxx';
$link = mysql_connect($db_host,$db_user,$db_pass) or die('error');
mysql_select_db($db_database,$link);
mysql_query("SET names UTF8");
$results = "SELECT sum(sales_order),date FROM chart_sales WHERE date >='".$start."' AND date <='".$end."' GROUP BY date ORDER BY date ASC";
Now im stuck witch json_encode :(
Or could you explain how to use Idiorm public function sum?
You should escape the $start and $end variables before including them in your query, as now your code is open to SQL injection attacks. I would advise you to use pdo or a library like idiorm that will sanitize your variables automatically.
I am not sure what you want to do with your query. Do you want to show a sum of all the sales for the period? If you want to only convert the code from Idiorm to mysql_ functions, you don't need the sum() part - sales_order already holds the sum of the sales for the day.
Hi,
i have database witch date field is not assigned a unique index.
id | date | sales_order
1 | 2013-01-01 | 10
2 | 2013-01-01 | 23
3 | 2013-01-02 | 67
4 | 2013-01-02 | 67
etc..
now i try to sum() 'salesorder' and GROUP BY date.
i dont know how to use Idiorm function sum() in this case, so I'm trying to convert the code from Idiorm to mysql functions :)
Thank you for your response
OK, Now i see my mistake...
"..as long as you return the correct JSON response from your PHP script, there won’t be any problems"
I had an error when i create mysql_ functions :)
I have a request: Can you give me an example to escape the $start and $end variables? I'm still learning :)
You are awesome thanks for giving this application
Really nice tutorial!! Very useful! :)
Hah really nice and without any flash plugins and stuff - perfect! :)
Beautifull! Thank you.
Is there way to make this chart into a Wordpress plugin If so please let me know it.
Beautiful. Well done
I very like your tutorials
Exactly what I needed thanks!
Wow! I can't wait to implement this somewhere. I'd really like the visuals of it. GREAT WORK!
Hi Martin,
excellent tutorial! Does x-charts support multiple dotted-lines on the same chart?
thanks, it 's very useful
Great tutorial. I was wondering if the download came with the random data as well?
I am wondering about this the other day, thanks for saving me some time! You always provide useful tutorials.
Hi,
Awesome tutorial,
I'm wondering how to make the d.y show decimals, right now it seems to be round it up.
this part in script.js:
tt.text(d.x.format(' {ord} {Month}') + ': ' + d.y)
do I need to change something in xcharts.min.js, where to look?
Great tutorial and very nice looking.
HI, I have a question. How can I draw a label to show the number on each bar?
I've seem to have found what i was looking for needed to change this in script.js
y: parseInt(this.value, 10)
for
y : Number((this.value).replace(/[^0-9.]+/g,""))
I hope it helps someone else too.
Hi Kentoro ... Thanks a lot.
I had the same problem.
Kriss
Thanks kentoro
Excellent tutorial which I've successfully implemented with Python+Django.
One question, though: How would I place objects (bullets, etc.) at specific points within the chart, as seen here: http://screencloud.net/v/sPAv ?
Thank you very much!
If it's not too much to ask, I would like to know if this can easily be dragged, eg drag from one year to the other without the daterangepicker.
Thanks, this is so awesome. :')
Hi!
Nice tutorial! Is there a way to put two (or more) charts on same page? Thanks in advance
Superb ........
I need two different chart is same page. Is it possible?
I need two different chart in same page. Is it possible?
Hi, thanks for a great tutorial!
I however just noticed that the custom range calendars shows the wrong weekday, today (2013-04-23, tuesday ) for example, it shows Friday. This occurs on the demo aswell as my own implementation of the daterange picker.
Any advice how to recitfy this?
Sinceraly
/Adam
is it possible to get the data if we have one more column in table and get the data for specific value of that data... say sale of some particular item.
i made the changes in scripts.js and ajex.php but i am not getting where to change for the rest.
As above change i am getting the data on load but not able to get the data if i change the date range.
i am getting the input for the item using GET.
Hey Martin,
Is there a way to use this chart with cakephp? I am confused about combining idiorm with cakephp default query structure.
Thanks
I haven't used CakePHP, but the best way would probably be to convert the code from Idiorm to that of CakePHP's built in database querying functionality (be it an ORM or another kind of abstraction).
Thank you for your tutorials, How I can show legend on xcharts ?
Nice tutorial, I dont see any legend implementation atm but it might be on the table (as suggested here: https://github.com/tenXer/xcharts/issues/30). I guess you have to show it outside the graph with the same css colors as the lines (as I had to do for a project).
The option that I'm missing is I need to invert the values on the Y-axis so they start from 1 at the top and inscrease toward the bottom. Couldn't get it to work but I'm already deep into using this plugin so I can't switch easily so I had to leave it for now with minus values rolleyes.
Martin, have you come accross this problem or you're not using xCharts that much, only for this tutorial ?:)
Will it work on IE 7 & 8?
how to display x- and y-axes label in xcharts?
Hi Martin,
I'm using your implementation of xCharts and DateRangePicker for a while but recently I've noticed that the display of weekdays in the picker are wrong (you can confirm it by checking the demo here, it says Saturday for 2014/03/25)
Currently I'm trying to debug it, with no luck yet. If you have some spare time, would you be so kind to have a look at it?
Thanks in advance,
Misel
Mr. Martin Angelov, This is a nice plugin for my website. However, I need to ask you a clarification.
I edited your SELECT query according to my website : $fragment = "SELECT COUNT(date) FROM marketing";
I wanted to count the rows based on its date. However, the chart does not work, Please help me on this. Thanks